
One of the most common challenges I see from clients using Tableau Server is around how they manage their server’s performance at scale. The story usually goes something like this:
- Initial Install of Tableau Server (low number of users, low utilization, fast server performance)
- Adoption grows (users increases moderately, utilization becomes more frequent, volume of content grows, fast performance maintained)
- Adoption continues to increase (users added daily/weekly, daily content interaction/creation, regular update of content on server, noticeable but manageable performance declines witnessed)
- Critical mass reached (100s to 1000s of users, constant content interaction, simultaneous updates of content occurring throughout the day, performance declines to a point where it impacts ability to conduct analysis)
Of course the desire is to never reach the point where the performance of your Tableau Server environment impacts the ability to do business, but it’s an unfortunate reality that you may have faced. So what do you do about it? To understand how to manage Tableau Server performance we first need to understand what drives it. For the remainder of this post we’ll refer to this as “load”.
What is “Load” and Why does it matter?
Load is defined as a measure of the amount of computational work that a computer system performs. It most commonly refers to CPU but can also refer to memory usage, network data transfer, and disk operations like I/O. We’ll focus on all of these as they are all impacted by Tableau Server’s application processes, albeit in varying degrees depending on the process.
What drives “Load” on Tableau Server
Under the hood of Tableau Server are several different application processes that combine to create the experience. You can learn more about them here but when we talk about what drives load we’re really talking about 3 processes:
- Backgrounder - executes server tasks, including extract refreshes, “Run Now” tasks, subscriptions, and tasks from tabcmd
- Data Engine (also known as the TDE Server) - Stores data extracts and answers queries
- VizQL Server - loads and renders views, computes and executes queries
Each of these processes is responsible for a key part of the Tableau Server experience and they frequently work in combination to accomplish the demands of users consuming, updating, and publishing content.The degree to which each process impacts your server’s performance will depend on your Tableau Server architecture. For example, if your server has a large number of extracts being refreshed concurrently, the Backgrounder process is going to affect performance more heavily than a server that favors live data connections. We won’t dig into architecture decisions in this post but how you design your server (single vs. multi-node, dedicated node for Backgrounder processes vs. mixed use, high-availability, etc.) is also a key consideration for how your server performs. For now, let’s dig into the 3 processes above to understand their impact on load in greater detail.
Backgrounder
The Backgrounder process is responsible for a large number of tasks but the most commonly used ones are extract refreshes, “Run Now” tasks, subscriptions, and any command initiated from the tabcmd utility. Any time you refresh an extract on the Tableau Server (manually or via a schedule), it’s the Backgrounder process at work. By design, the Backgrounder process is a single-threaded process and there can be multiple Backgrounder processes running at the same time. If you’ve ever seen the Tableau Server Maintenance page this will look familiar:
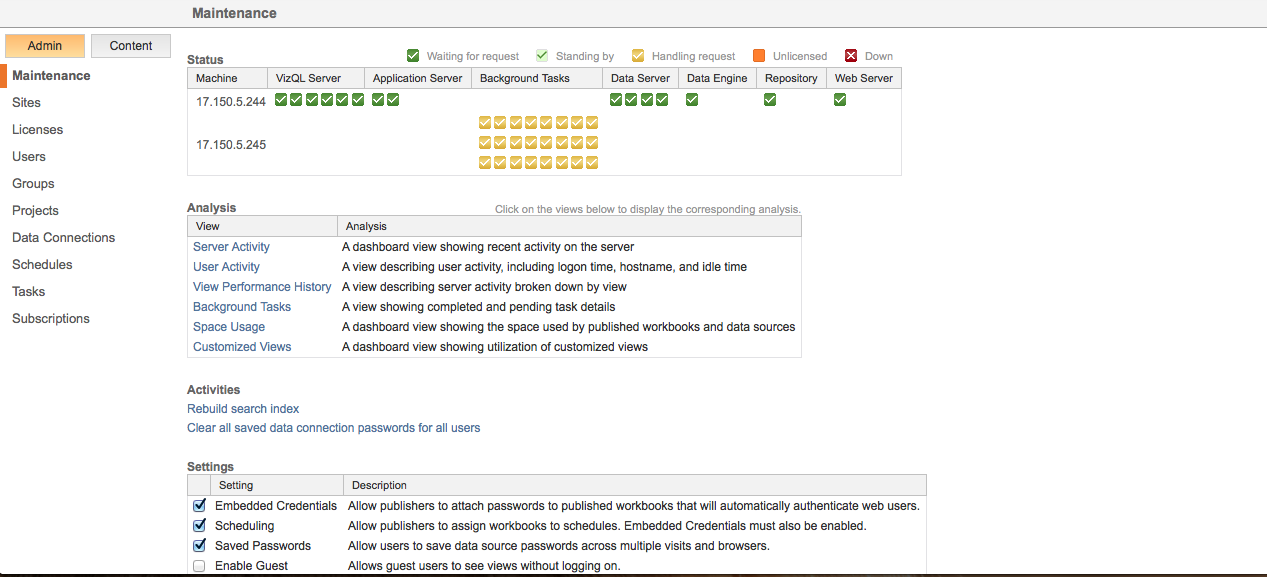
In this configuration, there are 2 nodes in the server cluster and one of them is dedicated to Backgrounder processing with a total of 24 Backgrounder processes. This allows the server to execute 24 simultaneous Background Tasks.
It’s important to note that single-threaded does not mean that multiple processes can’t run in parallel. What it refers to is that a CPU core cannot be logically split to share the workload, a process known as hyper-threading. Tableau Server does not currently support hyper-threading because each Backgrounder process has the ability to consume 100% of the CPU resources for a given core. Instead, multiple Backgrounder processes are used and the server runs one task per process, on separate cores.
Having said all of that, the Backgrounder processes primarily drives CPU, I/O and network resources. A large extract refresh could consume a lot of the network resources due the transfer of large data volumes and running several of these simultaneously can cause CPU on the server to spike. We’ll discuss how you track and manage this in a bit.
Data Engine
The Data Engine is what powers the data in your visualizations. The VizQL server, API server, data server, and background server processes all rely on the Data Engine to load the data into memory where it can then be queried at high speed. This is what allows Tableau Server to perform some operations faster when using extracts as opposed to live connections. As you’ve probably guessed, the Data Engine primarily drives load in regard to Memory usage but under high load it can consume CPU and I/O and lead to performance bottlenecks. If taxed too much, a single instance of the Data Engine can consume all CPU resources while it is processing requests resulting in slow performance for users interacting with content. It is common during an extract refresh that the Data Engine will be employed to write the data to its repository.
VizQL Server
The VizQL Server is the process that loads and renders views & computes and executes queries. This is rendering engine that takes your data and turns it into the visualizations that you’ve designed. Every time you load a workbook or make a filter selection, the VizQL process is querying the Data Engine and rendering the results. Load can only be associated with this process from browser-based interactions meaning that it’s driven by users performing tasks on the Tableau Server. The more users you have interacting with the server at a given time (concurrency), the higher the load is going to be on the VizQL process(es). Most often when users complain that it takes a long time to load a workbook, it’s the VizQL process that is experiencing heavy load. VizQL consumes CPU, I/O, or network resources and these processes can sometimes run out of memory.
How Do I Measure “Load” and What can I do about it?
Now that we understand what drives load, we need to measure it to understand where the constraints are. Tableau has released an open-source tool call TabMon that captures performance statistics on your server’s hardware and presents it via a set of Tableau workbooks so you can analyze it and make changes to your server’s configuration. There’s also a great series from Paul Banoub on How to Monitor Your Tableau Server. Below is an example of a visualization I’ve used to track the CPU, Memory and Disk load on my server’s hardware:
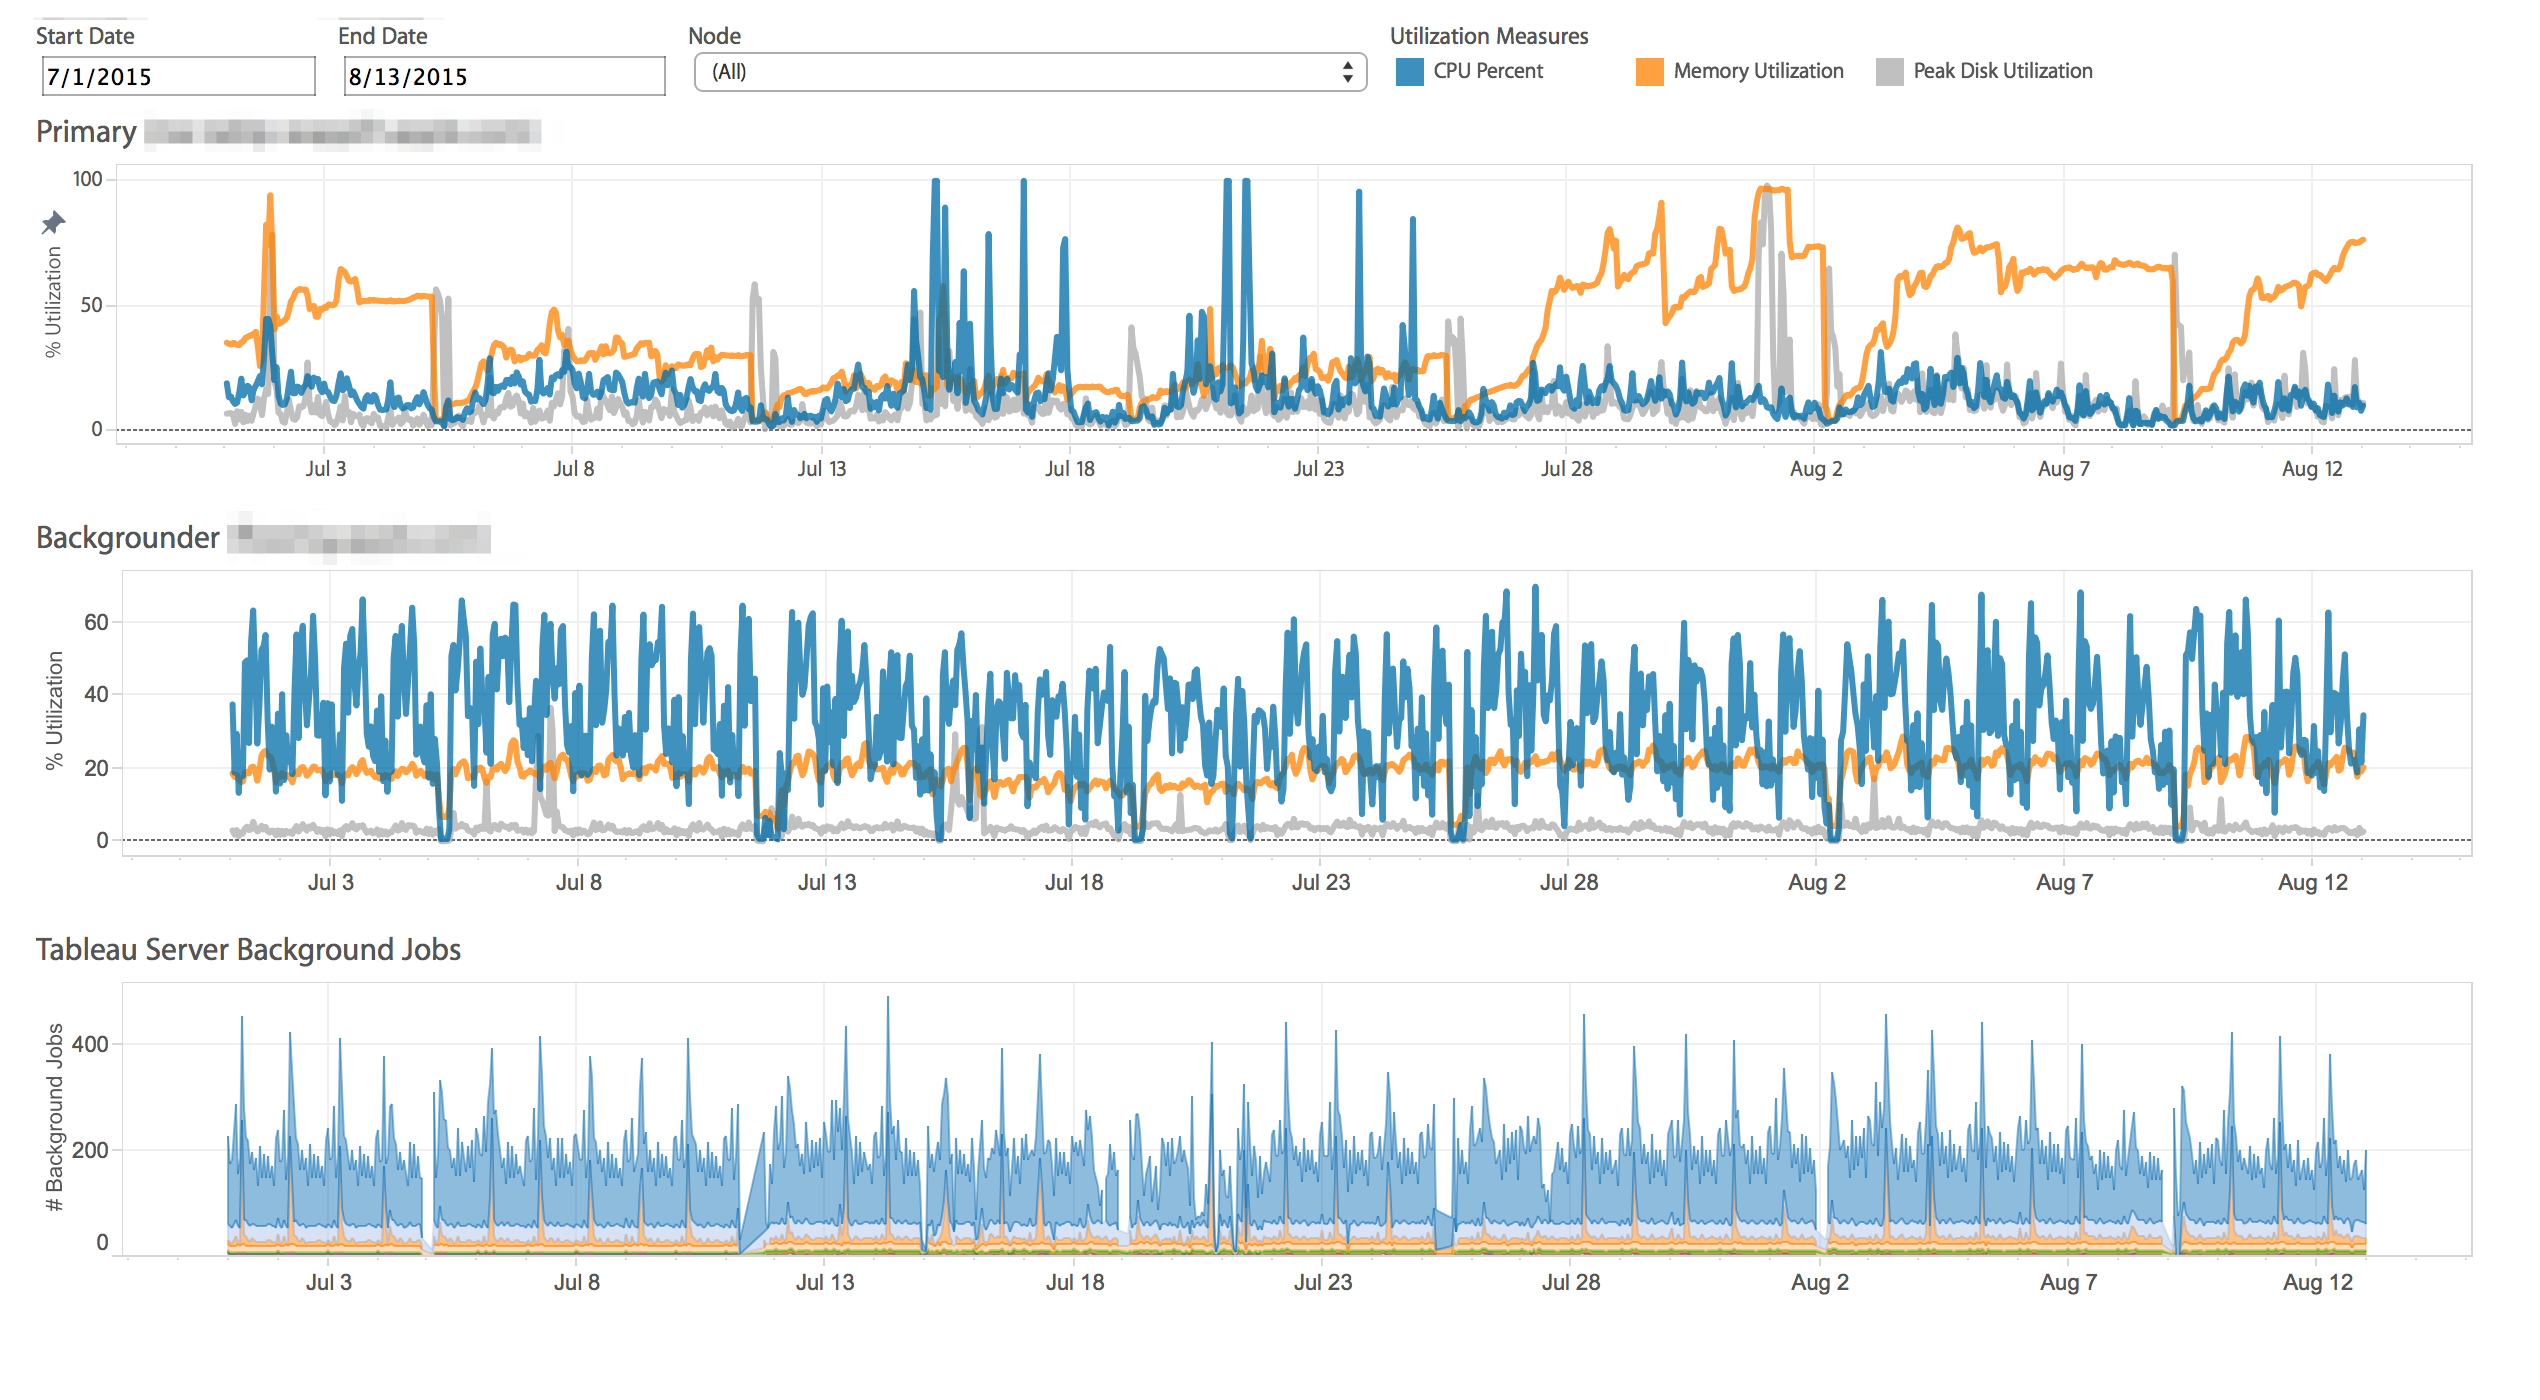
CPU, Memory, and Disk utilization at 1 hour increments
Depending on what you learn from the results, you might just need to add a couple of additional processes but if you’re really at capacity an architecture change could also be in the cards. Understanding how Tableau Server performs at scale is critical to providing your users with the best experience possible. Whatever insights you uncover, it’s best to review them in the context of what your users are doing. Talk to them and find out where they are experiencing issues when using Tableau Server and see if the data corroborates their stories. Develop a plan to address those topics and remember to capture the evidence from your server so you can see if the changes made a difference.
Leave a Comment