I just returned from an amazing week at Tableau’s annual conference in Las Vegas and I’m incredibly excited about the new features shown during the keynote. Presented by the developers themselves, Tableau showed off a slew of game-changing enhancements that will likely make their debut in the next major release, Tableau 10.
Here are a few of the features that will be part of Tableau 10 (if not sooner):
Tableau Desktop
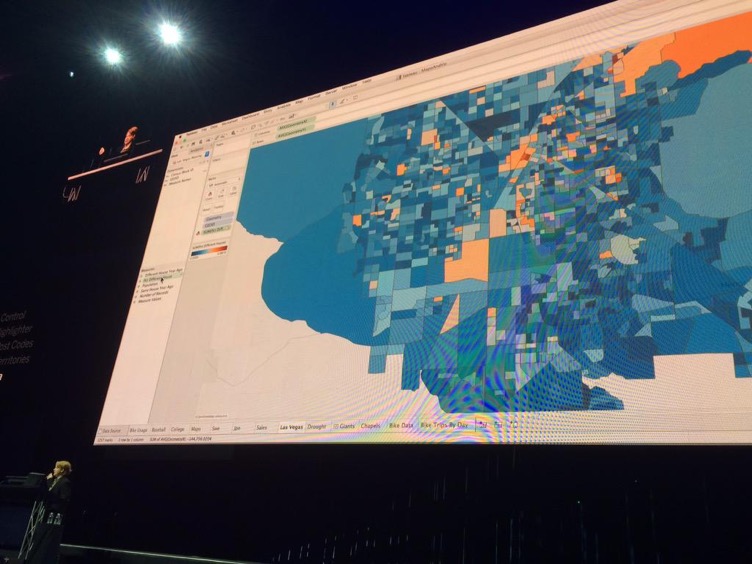

- Total Control – Most notably the ability to prevent Grand Totals from affecting color palettes. Long overdue but very welcome.
- Data Highlighter – Using the power of search to highlight points of interest.
- Global Post Codes, Custom Territories, & Spatial Data
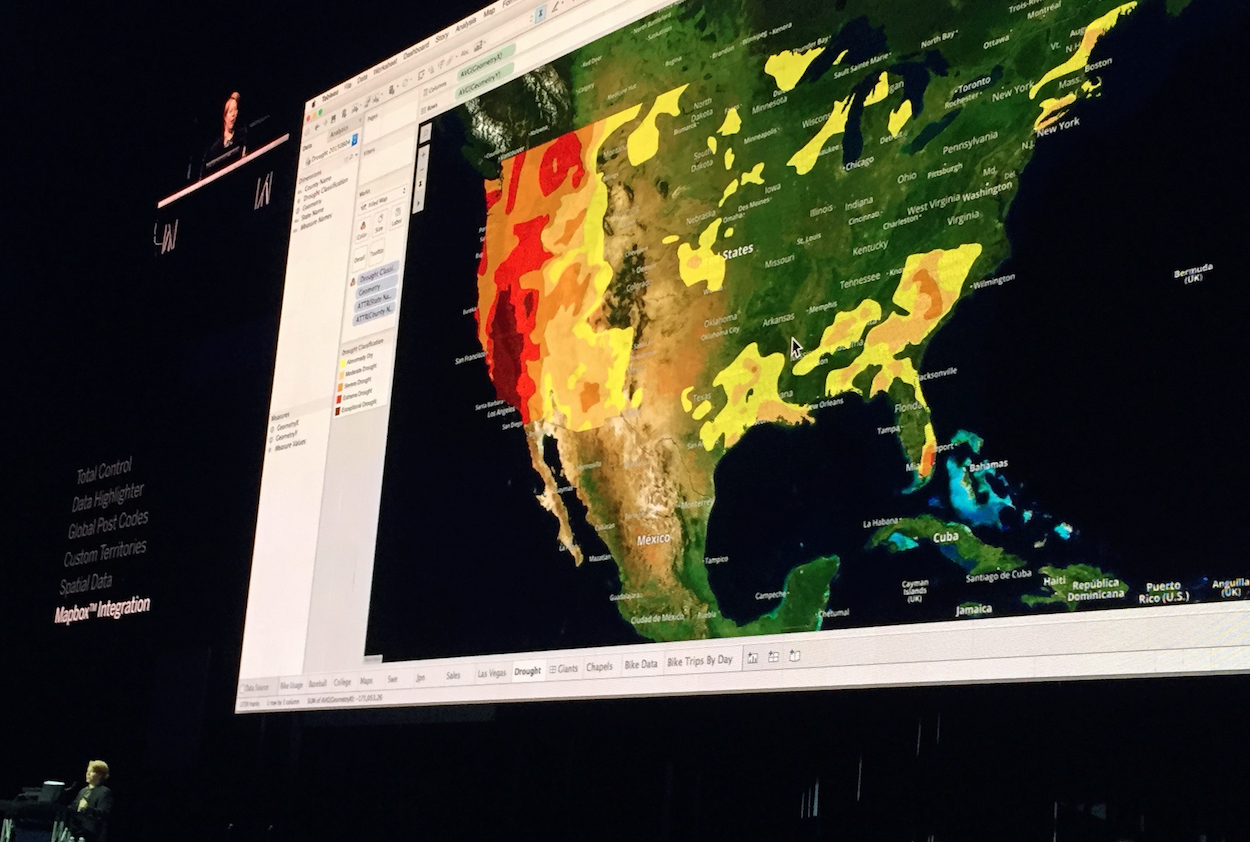
- Mapbox Integration (coming in 9.2) – This is exciting. Now you can integrate new maps & map layers from Mapbox including topographical maps and drive time information.
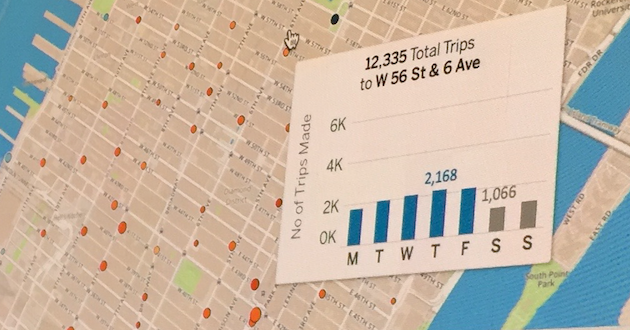
- Viz within a Viz! – This drew a standing ovation from the crowd at the keynote when it was demoed. Being able to embed a Viz within in tooltip is going to change the way people design in Tableau. Expect some really cool uses of this once the community gets their hands on it.
- Cross Database Joins & Filtering
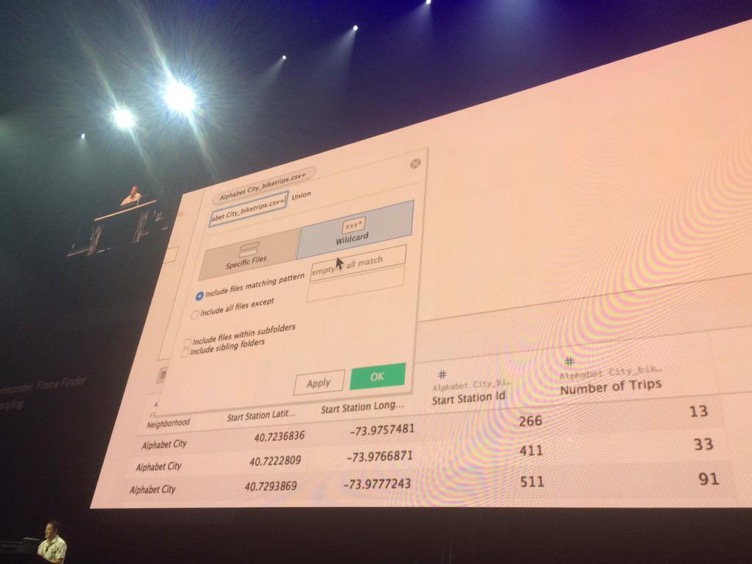
- Union of Data Sources
- Advanced Date Recognition (9.2)
- Advanced Analytics (Outlier Detection, native K-means Clustering) – Bringing the power of tools like R natively into Tableau will reduce the learning curve for many users that want to run advance statistical analysis on their data. I expect this is just the tip of the iceberg for what will come in the future. Maybe predictive analytics someday?
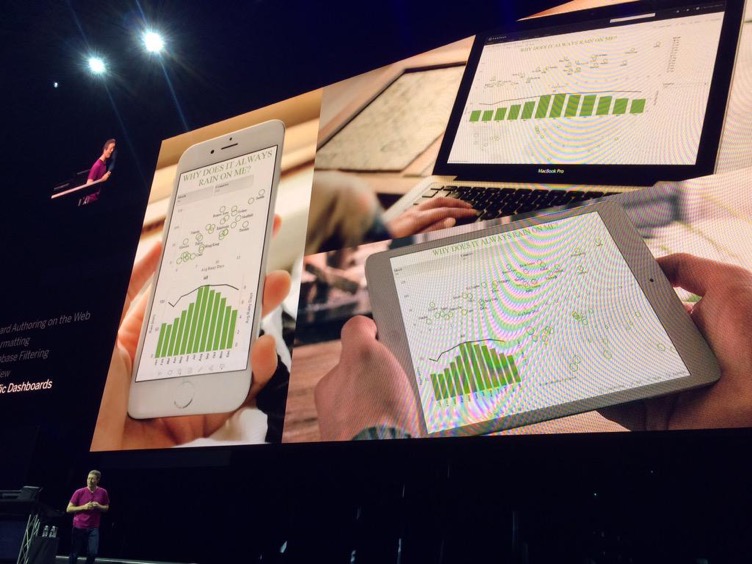
- Device Specific Dashboards – A clever new feature. You’ll be able to create different layouts of a single dashboard that render differently depending on the device being used. This is a must have for mobile adoption but I’m wondering if something will be lost in translation.
Tableau Server
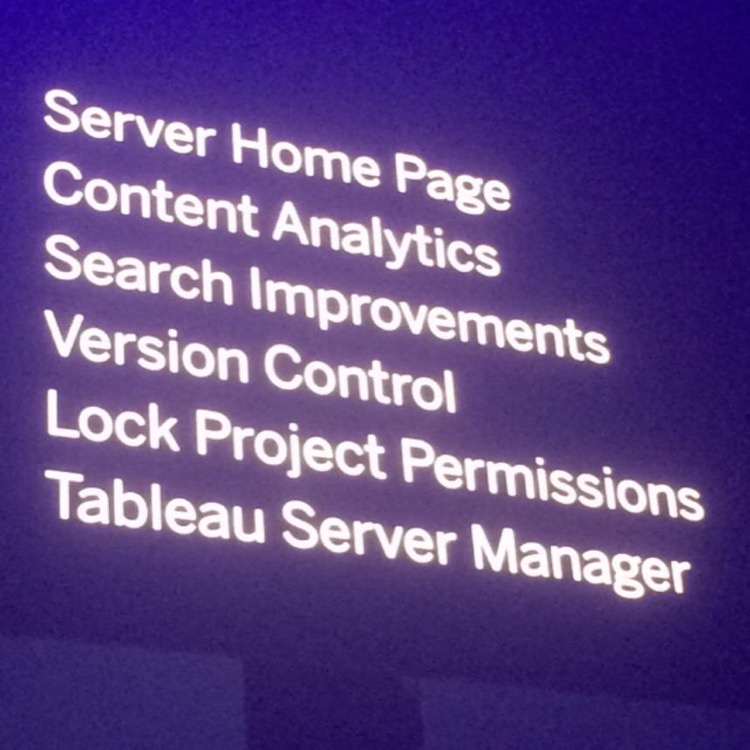
- Version Control – Ever overwrite a published workbook by mistake? With version control you’ll be able to easily restore that old copy with just a couple of clicks.
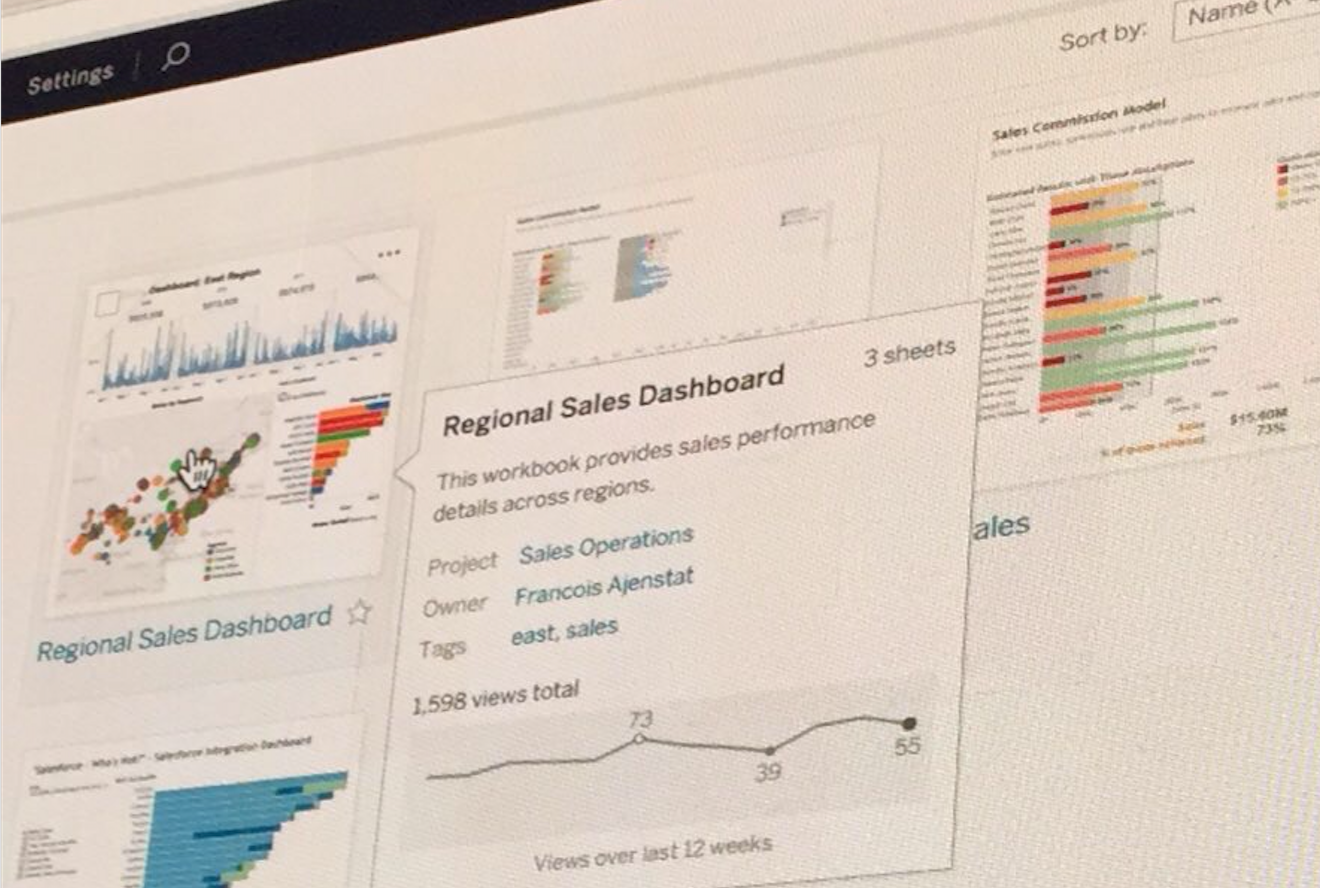
- Content Analytics (Sparklines and Bars) – This one caught me by surprise. Tableau has come up with a simple, elegant way of surfacing some high level usage stats on content. Incredibly useful and unobtrusive.
- Search Improvements
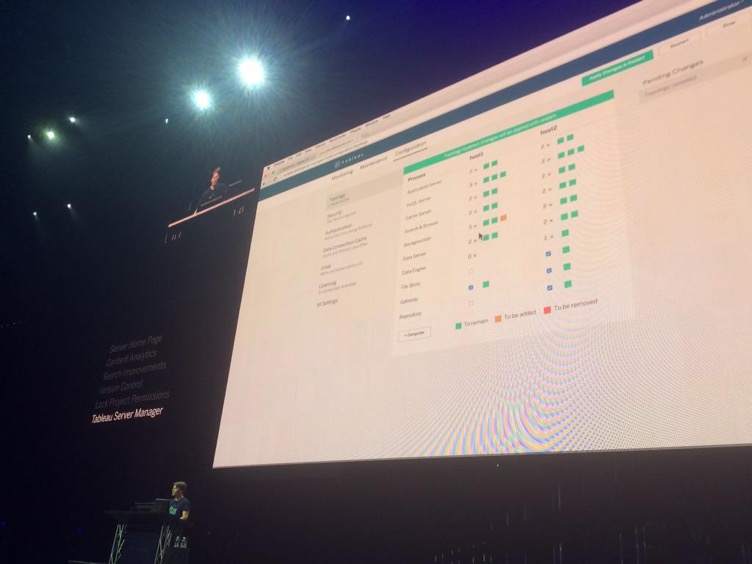
- Tableau Server Manager – A dedicated web app for admins to make server configuration changes.
- Lock Project Permissions
- Full-Feature Web Authoring
Of all the features shown during the keynote, the ones with the biggest potential to change how we see and understand data with Tableau are going to be the Cross Database Joins and Filtering. Today many of us use parameters to get around the limitations of quick filters on dashboards but with cross database filtering that won’t be as big of a need anymore. I’m most excited about the cross database joins. Connecting to Live DB and Excel in a single datasource?! Goodbye data blending!
What were you’re favorite features mentioned during the keynote? Did I leave anything out?

Leave a Comment